Research Report
A Report on Beverage Logo Advertising and Availability on the UC Berkeley Campus
In 2019, the Berkeley Food Institute undertook a project to investigate the beverage landscape at the UC Berkeley locations that are affected by the PepsiCo contract. This report summarizes the research findings and proposes next steps to improve the health of our campus environment.
Consumption of sugar-sweetened beverages (SSBs) [1] is strongly linked to diet-related short-term consequences like dental caries, as well as long-term chronic diseases such as diabetes and cardiovascular disease. These poor health outcomes disproportionately affect low-income communities and communities of color, contributing to health inequity. For instance, over half of Hispanic Americans and African Americans are projected to become diabetic within their lifetime compared to about one-third of non-Hispanic white Americans. SSB marketing also disproportionately targets these marginalized communities, contributing to an environment that negatively influences their diets.
To prevent poor health outcomes that result from excessive SSB consumption, the City of Berkeley and UC Berkeley have taken action. The City of Berkeley implemented a SSB excise tax in March 2015 to help address the growing obesity epidemic. Dr. Kristine Madsen, Associate Professor at UC Berkeley and Faculty Director for Berkeley Food Institute, Dr. Jennifer Falbe, and their research team found that the tax led to a 52% decrease in SSB consumption in low-income Berkeley neighborhoods from 2015 to 2018. At UC Berkeley, the Coalition for Healthy Campus Food and Beverages was established in January 2019 to raise awareness around the implications of our campus’s food and beverage choices for human and planetary health. In January 2019, UC Berkeley also implemented the Food and Beverage Choices Policy which aims to promote a healthier food and beverage environment. The Policy expands healthier options such that no less than 70% and 50% “healthy” beverage products are sold in retail markets and vending machines respectively. The Policy generally classifies “healthy” beverages as sparkling water; 100% juice; unsweetened tea; and smoothies—namely, those containing under or equal to 71 mg of added caffeine per 12 ounces and low-calorie beverages under 40 calories per 8 ounces. Thus, SSBs are excluded from the “healthy” category. The Policy also prioritizes advertising of healthy foods in marketing spaces and healthy product placement. Ultimately, this Policy strives to create systematic changes to improve health outcomes for the UC Berkeley community—students, staff, faculty, and visitors.
UC Berkeley is in year nine of a ten-year pouring rights contract with PepsiCo for beverage service across Cal Dining dining halls and retail outlets, student housing, campus vending machines, athletics concessions, and special events. This means that since 2011, our campus has exclusively sold and advertised PepsiCo-owned products [2], which include 20 total beverage brands of SSBs and non-SSBs [3]. The current PepsiCo contract predates the Food and Beverage Choices Policy and is therefore exempt from the Policy. The Policy will begin to impact beverage service contracts and leases in the affected areas of campus once the current PepsiCo contract expires in July 2021.
Simultaneously, the UC Office of the President, in recognizing the detrimental effects of SSBs on employee health, has dedicated system-wide funding toward improved tap water infrastructure and opportunities for healthier beverage zones through the Healthy Beverage Initiative.
In 2019, the Berkeley Food Institute undertook a project to investigate the beverage landscape at the UC Berkeley locations that are affected by the PepsiCo contract. These are also campus locations heavily used by students. The project objectives were to collect comprehensive data on the number and proportion of 1) beverage logo advertisements on posters, vending machines, or other fixed spaces, and 2) beverage and beverage types availability as they compare to the goals of the Policy. This report summarizes the research findings and proposes next steps to improve the health of our campus environment.
Methods
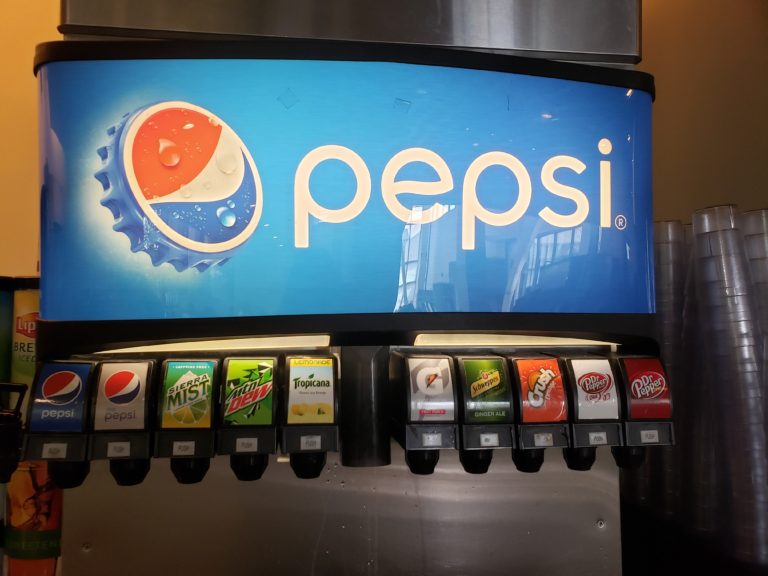
In the 2019 spring semester (March – May), three trained data collectors gathered data on the beverage advertising and availability on the UC Berkeley campus. The data collection focused on physical locations associated with four key programs – Associated Students of the University of California (ASUC), Residential and Student Service Programs (RSSP), Athletics, and Recreational Sports [4]. These are all locations covered in the current exclusive pouring rights contract with PepsiCo. They are also locations with high student traffic. Specific locations included residential hall vending machines, retail markets, and dining commons, such as Crossroads Dining Commons; campus gyms like the Recreational Sports Facility; and the Martin Luther King Jr. Student Union. Photos of all beverage ads and product availability were taken on-site, and data were entered into standardized forms. Beverage logos were categorized based on physical fixture display types, including: logos on dispensers and vending machines; sports marquees; posters; fridges; and retail shelves. Beverage logo ads were categorized into five sizes in comparison to an 8.5”x11” sheet of paper: smaller than ¼ page (XS), between ¼ to 1 page (S), between 1 to 4 pages (M), larger than 4 pages (L), and larger than an average person (XL). Product availability was assessed based on number of buttons on vending machine and drink dispensers, number of beverage bottles facing outward on shelves of refrigerators or aisles, and number of floor stack packages.
For both logos and beverage availability, beverage types were categorized into sugar-sweetened beverages (SSBs) and non-sugar-sweetened beverages (non-SSBs). SSBs included soda, energy drinks, sport drinks, and fruit-flavored drinks that contain added sugar. Additional data collectors also compiled a comprehensive list of the sugar and caffeine content of each beverage present on the Berkeley campus, referring to nutrition information posted on the manufacturer’s site [5]. Of note, many non-soda SSBs contain more sugar than soda, such as lemonade. Non-SSBs included diet drinks, water, sparkling water, unsweetened teas and coffees, and juices with no added sugar.
We then assessed the number and percentages of beverage logos by beverage type and size, and beverage availability by beverage type, with the following results.
Results and Discussion
In total, we found 706 logos and 2,662 different beverage products across the study locations. See detailed results in the tables in the appendix.
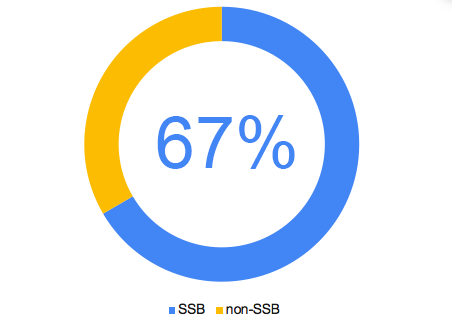
Figure 1. Percentage of advertising logos by beverage type
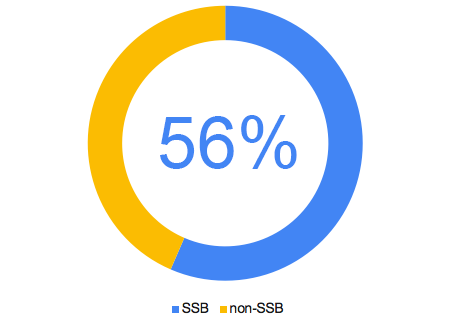
Figure 2. Percentage of beverage availability by beverage type
The data show that the beverage landscape at UC Berkeley in spring 2019 was dominated by SSBs: 56% of product availability and 67% of beverage logo advertisements were SSBs (Figures 1 and 2; Table 1). The top 3 beverage types available in order of frequency were still water, regular soda, and sports drinks (Figures 3 and 4; Table 3). Still water was the most available single beverage type overall at 15% of total beverages, and 35% of non-SSB types (Figure 3; Table 3). Within the category of still water, the composition was 75% Aquafina and 25% LIFE WTR (Table 5). Sodas and sports drinks were collectively the most available SSB types (Table 3): sodas comprised 12% of all beverage product options, with Pepsi, Dr. Pepper, and Mountain Dew as the most prevalent soda products (Table 4). Sports drinks represented 12% of overall beverage products (Table 3), with Gatorade Fruit Punch as the most prevalent single sports drink product (Table 4). While still water is the single most prevalent beverage type available at 15%, this is low compared to the 57% of beverage products that are SSBs.
The proportion of beverage logos that are SSBs was even higher than the proportion of non-SSB, at 67% of total logos (Table 1). Soda was the most marketed beverage logo type, at 40% of all logos (Table 2, Table 4, Figure 3). Pepsi was the most common brand of soda logos (Table 4), and also overwhelmingly had the most advertisements in the L and XL categories (larger than four pieces of paper), representing 82% in the combined size categories of L and XL (Table 2). Water (still and sparkling), was the next highest of larger logos at a mere 12%, marking a 60% difference between first and second of larger beverage type logos. Larger advertisements are more visible, and leaves a longer and larger lasting impression compared to smaller advertisements. With the PepsiCo contract in effect at popular student-centered spaces at UC Berkeley, health equity among our diverse student population is of particular concern. UC Berkeley is contributing to the lifetime messaging by creating an unhealthy beverage advertising environment that already disproportionately affects marginalized communities.
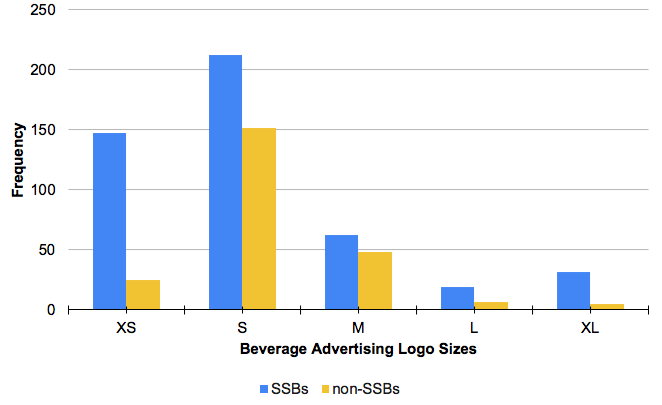
Figure 3. Frequency of beverage logos by beverage size and type
The pervasive SSB logo advertising also does not reflect the product availability offered—there is a misalignment between advertising and availability in retail, dining, and vending spaces. Recent national market research demonstrates beverage purchases are trending away from excessive sugary drinks, and anecdotal data from the Berkeley campus echoes this trend. So why do advertisements still push so heavily for these less popular SSBs? The predominant advertising of SSBs at gyms and athletic venues, is also contrary to spaces strongly associated with health (Table 7). The marketing technique, similar to the health halo effect, can psychologically tie SSB brands to a false belief of good health. The resulting consequence of food and beverage sports sponsorship may lead to preference or consumption to marketed, less healthy goods as seen with alcohol sports sponsorship and greater alcohol consumption.
Our data demonstrate that the beverage environment did not align with the Food and Beverage Choices Policy, which is not surprising given that the Policy does not apply to a past beverage contract. The results do show an alarming presence of SSB logos and products on the UC Berkeley campus, especially large logos. Ultimately, both product availability and logo advertisements do not match the current market trends away from sugary drinks and the local SSB taxes in Berkeley, Oakland, and San Francisco.
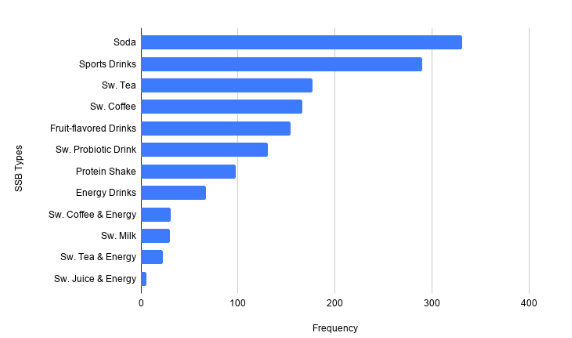
Figure 4. Frequency of SSB types
Limitations
A few limitations exist in this study. The first is that only beverage advertising physical fixtures were evaluated, thus excluding other advertising forms such as experiential events, swag, and animated signs (such as those on display during stadium games). Another limitation is that this project only focused on the primary campus locations under the current exclusive PepsiCo contract. It does not represent the entire scope of campus locations, such as third-party restaurants (i.e. Free Speech Movement Cafe and Yali’s) or vending machines scattered throughout other buildings on campus. Locations further from the central campus like the Berkeley Marina, which is part of Recreational Sports, or publically inaccessible after two data collection visits like the Haas Pavilion, were also not evaluated. The study was also conducted during off-season of the football season, so the full scope of the beverage in concessions are unaccounted, and thus may underestimate the presence of SSB availability.
Recommendations
As the current PepsiCo contract is exempt from the Food and Beverages Choices Policy, we recommend that UC Berkeley’s future beverage service—e.g., through Request for Proposals or contracts—is in compliance with the Policy. Specifically, any new beverage contract should include language that matches the recommendations made by the Policy to ensure that vendors legally agree to providing services that align with UC Berkeley’s Policy. Once the Food and Beverage Choices Policy is applied to Berkeley’s beverage service, the significant limitation of SSB availability on shelf and vending spaces will support a healthier environment. Meanwhile, we encourage PepsiCo to work together with UC Berkeley to apply the Policy’s recommendation for the remainder of the current contract.
The Food and Beverage Choices Policy lacks a similar rigor with the marketing presence of beverage logos, as it does not address logos and marketing in detail. Like the maximum restriction of 30% available SSBs in retail and 50% in vending, the Policy can adapt a similar limitation in the ratio of SSB to non-SSB logo advertisements. We recommend limiting SSB advertising to under 30% of total logos. For instance, the federal Healthy Hunger-Free Kids Act of 2010 mandated K-12 schools to implement strict wellness policies that completely bar marketing of high-calorie drinks, which includes most SSBs [6]. A policy update regarding less than 30% SSB logos can reduce the prevalence of SSB advertisement by at least 37%. Special considerations should also apply to logo size restrictions, especially for logos grander than four pages of paper, such that less than 10% of logos in this size category be SSBs. Due to the greater impact of large logos, we would impose a strict recommendation that no SSB logos are allowed that are larger than a person. For a similar purpose, venues that promote health such as gyms and the University Health Services should not have any conflicting messages by allowing SSB advertising. Ultimately, the Policy’s section on marketing can be strengthened to dissociate the university from misaligned branding among the UC Berkeley community.
The current scope of the Policy is limited, featuring only retail and vending outlets. However, dining commons and Athletics concessions are not explicitly mentioned. Drink dispensers in RSSP dining commons featured 39% all logos and 7% of available beverages (Table 6). The Policy should also be revised to apply to additional venues such as dining commons and concession stands.
In addition, environmental sustainability will be impacted by future beverage services. Bottled water is the most prevalent beverage at retail markets and second most prevalent in vending machines. Simultaneously, UC Berkeley has Zero Waste environmental sustainability goals. The prevalence of bottled beverages, both SSBs and water on campus, are in conflict with these sustainability goals. The ASUC took first steps by banning the sale of water bottles at the Student Union in 2014. If UC Berkeley bans bottled water to align with Cal Zero Waste goals, how would this affect the beverage mix in the retail and vending environments? For example, when the University of Vermont banned bottled water, bottled beverage purchases decreased, and bottled SSB sales increased on campus. The result was contrary to their goal of reducing plastic waste and had adverse health effects. If UC Berkeley were to ban bottled water with the current mix, the majority of the beverage product portfolio would skew more heavily to SSBs. In contrast, Washington University in St. Louis banned bottled water without an increase in SSB sales, for either bottled SSBs or SSBs dispensed as fountain drinks, by highlighting the importance of increased access to water refill stations, promotional signs, reusable bottles, and student awareness— most of which Vermont was lacking. Rather than a complete bottled water ban, UC Berkeley could consider a bottled SSB ban and a reduction in overall available number of bottled beverages in the campus food system. In place of bottled beverages for sale, the Policy can mandate a minimum percent of beverages that must be on tap, combined with the sale of reusable cups or containers. The 2020 Healthy Beverage Initiative (HBI) at UC Berkeley aims to provide more access to tap water by increasing the number of water refill stations across campus, which provides alternatives to bottled products, and promotes tap water through its signage. HBI can work with Cal Zero Waste to uplift environmental sustainability while also addressing health.
In conclusion, we recommend stricter regulation on beverage advertising in the UC Berkeley Food and Beverages Choices Policy to reflect concerns for health and health equity among campus populations, and expanding access to non-SSB options beyond bottled water. Table 3 indicates thirteen other non-SSB alternatives, such as 100% smoothies and unsweetened tea, and we recommend increasing availability of these beverages. We also propose addressing the whole beverage system at UC Berkeley by continuing to invest in water refill infrastructure and promotion.
Acknowledgements
We are grateful to all the project contributors for their excellent work and feedback.
Data collectors: Isa Harrison, Amanda Hirashi, Joyce Hoang, Jordan Keen, Whitney Lau, Billy Lin, Roujheen Sabetan, Kevin Tuok.
Editor: Kim Guess, RD (University Health Services)
Citations
[1] SSBs are drinks with added sugar defined by the 2015-2020 Dietary Guidelines of America.
[2] The contract allows for a 15% exception for non-Pepsi brands to be sold in shelf placements below the knee. Dairy, brewed coffee, and alcohol do not fall under the contract. For example, UC Berkeley partners with Peet’s to provide freshly brewed coffee to the campus.
[3] Source: https://www.pepsico.com/brands/product-information
[4] Recreational Sports primarily serves the campus-affiliated population through their accessible recreational centers, while Athletics serve the the student athletes at training venues and general public through sports arenas.
[5] Source: https://www.pepsico.com/brands/product-information
[6] Source: https://www.fns.usda.gov/school-meals/fr-072916c; https://fns-prod.azureedge.net/sites/default/files/resource-files/USDASmartSnacks_508_62019.pdf; https://www.cdc.gov/obesity/downloads/community_strategies_guide.pdf
Appendix
Figure 1. Percentage of advertising logos by beverage type

Figure 2. Percentage of beverage availability by beverage type

Figure 3. Frequency of beverage logos by beverage size and type

Figure 4. Frequency of SSB types

Figure 5. Frequency of non-SSB types

Figure A. Example of logo analysis on a HelloGoodness beverage vending machine

Figure B. Example of logo analysis on a beverage vending machine featuring Pepsi

Figure C. Example of logo analysis on a beverage cooler

Figure D. Image of floor stack

Figure E. Image of sports marquee

Figure F. Image of logo advertising on flyer

Figure G. Image of drink dispenser

Figure H. Image of logo advertising on trash bin

Table 1. Comparison between percentage of product mix availability and advertising logos by beverage type

Table 2. Frequency of beverage logo (superscript a) sizes (super b) by beverage types

Table 3. Frequency of beverage type, by product availability

Table 4. Top ten SSB products available: frequency and characteristics

Table 5. Top ten non-SSB products available: frequency and characteristics

Table 6. Frequency of beverage type logos by display type

Table 7. Frequency of beverage type logos by location

Table 8. Frequency of beverage type availability by display type

Table 9. Frequency of beverage type availability by location
